Our pilot phase of the iCoast project focuses on modeling and monitoring the dispersal of pathogens in the Guana-Tolomato-Matanzas estuary, from both natural and anthropogenic sources, with an emphasis on Escherichia coli (E. coli).
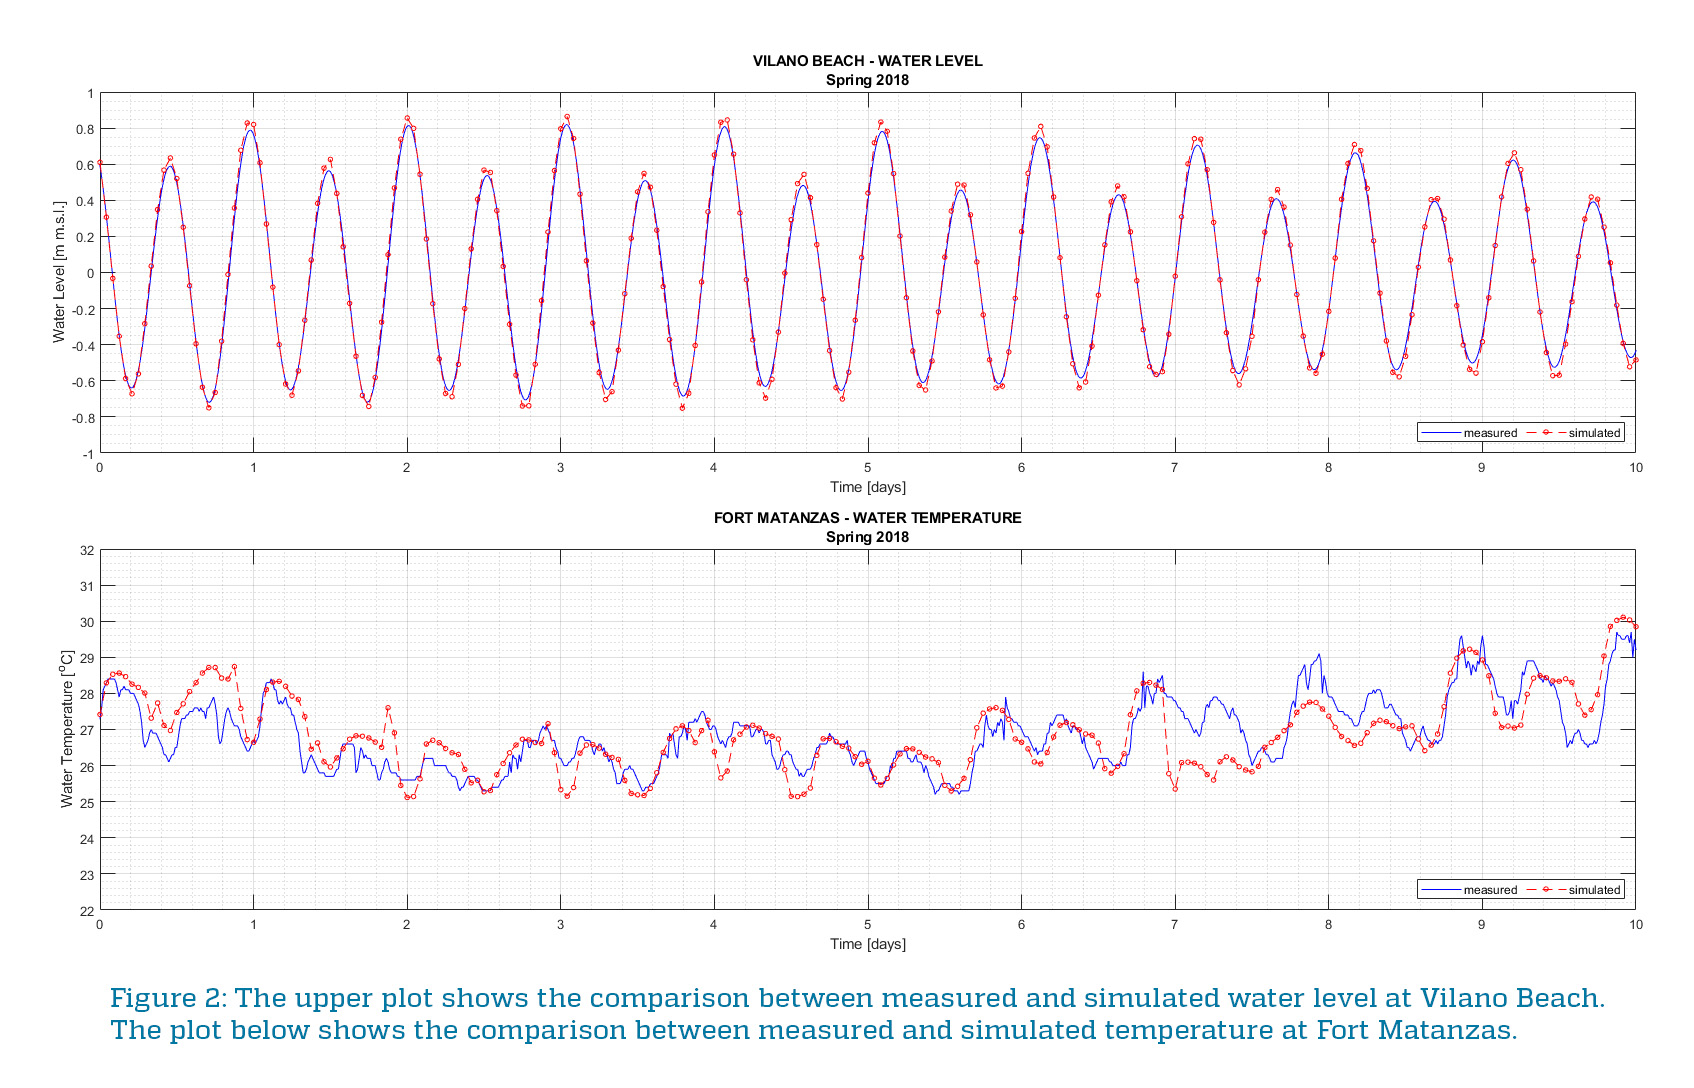
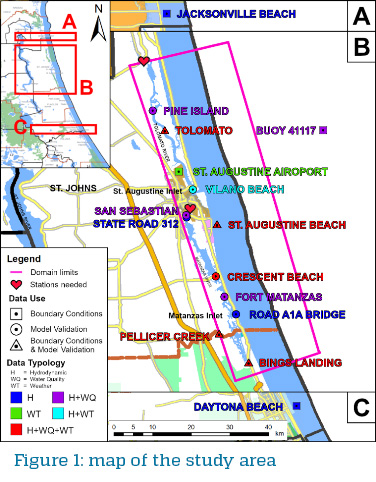 We have set up a Delft3D model for the GTM-NERR lagoonal system (see domain boundaries in Figure 1). The model is forced by astronomical tides at the offshore boundary, and at the northern and southern ends of the estuary. The hydrodynamic model has been calibrated by comparing the computed astronomical water levels with the astronomical water levels at four NOAA stations in the estuary, and one offshore. We found a very good agreement between the computed and measured water levels, the maximum error being smaller than 10 cm (Figure 2, upper plot). The model also simulates temperature variations within the estuary. The model takes as input the values of air temperature, cloudiness, rainfall, wind speed and direction, relative humidity, measured rainfall and solar irradiation measured at the GTMNERR stations. The temperature measured by the U.S. Army corps of Engineers buoy “station 41117”, has been prescribed at the offshore boundary, while at the northern and southern boundaries of the estuary we prescribed the temperature and salinity measured at two GTMNERR stations. There is a good agreement between the daily average values of computed and measured temperature (Figure 2, lower plot). The model is also capturing fairly well both the diurnal temperature cycle, as well as semidiurnal variations in temperature due to tidal advection of colder marine water and warmer estuarine water.
We are currently investigating how the release of a load of Escherichia Coli (E. Coli) would disperse in the estuary. E. coli mortality is strongly dependent on water temperature. Beside temperature, preliminary results show that E. Coli concentrations strongly depend on tidal flushing and neap-spring variations. The video below shows the time variation in E. coli concentration over a tidal cycle.